I was sent this link to a fascinating article, Fishing in Freefall, (published on NFFO 11 April 2013) about the somewhat dramatic results that have emerged as a result of the reduction in F over the past ten years in the North East Atlantic.
News that of course contradicts the narrative which most NGO’s continue to present, illustrating that many eNGOs are operating in lag, their information base is historic and has been superseded by more recent management measures).
By the way:
F = fishing mortality (mortality of fish as a result of being fished).
Fishing in Freefall
According to National Federation of Fishermen’s Organisations (NFFO), The International Council for Exploration of the Sea (ICES)’s most recent advice has confirmed that fishing pressure across the main commercial stocks has fallen to a remarkable degree.

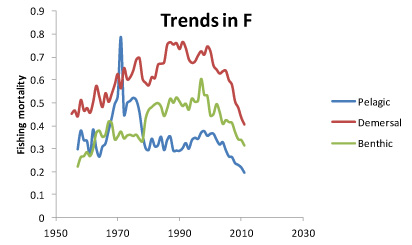
This graph in the ICES advice illustrates vividly how after something like 70 years of incremental increases in fishing mortality (F), the trends after the year 2000 have taken a dramatic dive. This fall in fishing pressure coincides closely with the period during which an array of “cod recovery” measures were applied to EU fleets, although many other factors are undoubtedly involved.
http://www.nffo.org.uk/news/nffo_fishing_in_freefall_2013.html

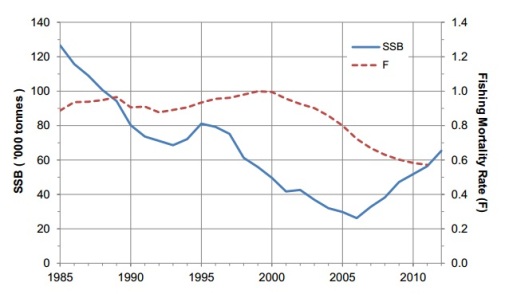
Fig. 1: The spawning stock biomass (SSB) and fishing mortality rate (F) of North
Sea cod from 1985 to 2012 (2011 for F). (Prior to the mid-1980s the
abundance of cod was influenced by the ‘gadoid outburst’ – see p. 4.)
Source: I Napier (2013) Trends in Scottish Fish Stocks.
http://www.nafc.ac.uk/WebData/Files/Note%20-%202013-03-26%20-%20Trends%20in%20Fish%20Stocks.pdf
Results show that Fishing mortality in the demersal and benthic stocks has been halved since 2000.
The fall in fishing mortality is remarkable in that it applies to all of the three main species groups pelagic (including herring and mackerel), demersal (including cod, haddock and whiting) and benthic (the flatfish including sole and plaice). It also applies right across the whole of the North East Atlantic area, including the North Sea and Baltic and waters around the UK.
Although the development of the pelagic stocks has taken a different course from the benthic and demersal, they are now rapidly catching up.
ICES summarises the situation:
“Fishing Mortality for benthic stocks gradually increased over time until about year 2000 and have since reduced substantially. For demersal stocks the increase was steeper in the beginning of the time period, peaked around year 2000 and has reduced since. The pelagic stocks have had a very different development over time. F increased significantly in the late 1960s and early 1970s. This resulted in the well known collapse of several important herring and mackerel stocks. Since then, F has been quite low and stable and like for the other two types of stocks, has decreased since year 2000.”
In many respects this development will come as no great news to many fishermen who have seen the fishing fleets reduced by decommissioning, consolidation and attrition, to the extent that previously busy fishing grounds are now quite deserted. But it is important to acknowledge the significance of the fact that this trend is now established in scientific opinion and also to consider its implications.
So what are the implications of these results?
On implication is a need to incorporate other aspects of mortality other than F when making management decisions. According to NFFO:
“The clear shift to a lower fishing mortality rate brings with it the need rethink the way we approach both fisheries advice and fisheries management. When the overwhelming concern was to reduce fishing pressure because it was such a dominant factor, there was little need to think too deeply about multi-species interactions – they didn’t really come fully into play. But now that the impact of fishing has been reduced, the need to consider predation patterns and cannibalism becomes much more important, especially for informing management decisions.”
ICES’ view is that:
“Stocks can become so large that they deplete their food sources and eventually eat their own kind. It is necessary therefore to think about the next steps in advice and management: It may be that it will be necessary to increase fishing pressure on some species to achieve an optimum balance.”
Another implication lies in the realm of public perception. For many years now the daily eNGO and media mantra has been “Global fish stocks are collapsing”
But now it seems that this has changed. According to the NFFO:
“North Sea cod, the iconic fish and chips species [in the North Atlantic], is rebuilding steadily to safe biological levels; many stocks are at the management goal of maximum sustainable yield and others are on the way. The recovery of some stocks like North Sea plaice is nothing short of breath-taking, with a biomass beyond anything seen within the historical record.
This is not to say that there aren’t some stocks that have yet to respond in the same way: West of Scotland and Irish Sea Cod are two examples where other factors may be impeding recovery. But the dominant downward trend is too well established, too widespread in geographical terms and across so many diverse fisheries, to be dismissed as a statistical blip.”

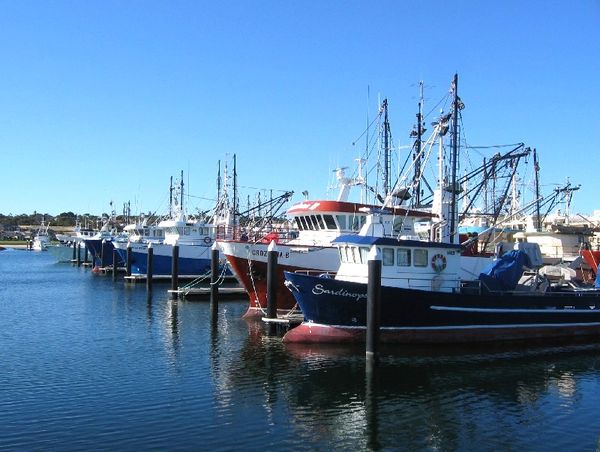
Fishing Vessels at Port.
Source: http://jonbowermaster.com/blog/2010/09/cure-for-overfishing-fewer-fishing-boats/
So what is the driver of this decreased F?
The NNFO article maintains that:
“The precise reasons why fishing mortality has dropped so decisively in recent years are not straightforward to discern. Numerous management initiatives have come into play simultaneously and disentangling which worked from which didn’t simply isn’t feasible after the event.”
According to the NFFO:
“Fleet reductions, tradable quota, increased selectivity, landing controls, effort control, an altered industry mindset, cod avoidance including real time closures have all been in the mix. Some have undoubtedly contributed, others have had perverse effects.”
ICES points to improved compliance and better control:
“For example in the Baltic Sea, Norway has been able to check the Russians in the Barents Sea. Other candidates include a move towards long term management plans, setting TACs in relation to maximum sustainable yield and better relations between the fishing industry and fisheries scientists. The answer lies surely in some combination of the above but the weight accorded to each is something that science cannot provide.”
Have these results been Peer Reviewed?
What instantly comes to mind apart from how quite remarkable and encouraging these trends are; is have these trends and results been written up. That is have the trends, the drivers and the implications outlined in the NFFO article been peer reviewed in the scientific literature?
Well here are two:
- Napier, Ian. (2013) Trends in Scottish Fish Stocks. Marine Planning, Policy and Advice Section – Fisheries Data Analysis. NAFC Marine Centre. http://www.nafc.ac.uk/Fisheries-Policy-Notes.aspx
- M. Cardinale et al. (2013) Rebuilding EU fishstocks and fisheries, a process underway? Marine Policy 39 (2013)43–52
Napier (2013) quantifies a trend showing the reduction in F and an increase in SSB (spawning stock biomass) for the majority of North Atlantic/British fishstocks.
M. Cardinale et al. (2013) analysed the status of 41 commercially exploited fish stocks from the North East Atlantic, North Sea and Baltic Sea (FAO Area 27) together with the economic performance of the fleets exploiting those stocks. According to the abstract:
“The analyses indicate that the exploitation status for many of the stocks has greatly improved during the last 10 years while the economic performance of the fleets over the same period has been highly variable. The main economic indicators (gross value added (GVA) and operating cash flow (OCF)) have gradually improved at a time when the general economic situation, which has a great influence on the markets, costs and purchase power, has worsened. While recognizing that much remains to be done to achieve the objective of the WSSD, the analyses indicate that actions implemented in the last decade under the CFP have led to an improvement in the status of many commercially important fish stocks and their fleets towards levels that are closer to those producing MSY.”
What’s my point?
My point is this… I am becoming increasingly confident about the provenance of the wild seafood that I eat!
Furthermore my confidence is becoming increasingly verifiable with objective scientific trends and results..
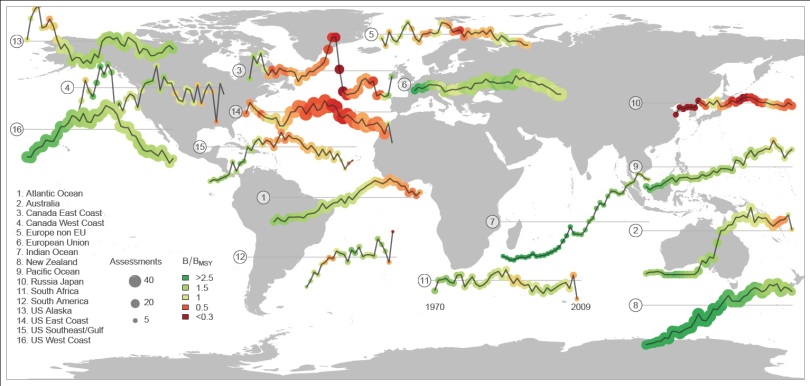
I was sent this unpublished chart the other day (which was put together by Ray Hilborn from the University of Washington) with the comment:
“See the attached plot I have made from data base comparing exploitation rates across different parts of the world… Look at Europe and the US.”
Yes – look at Europe and the US!

Map of the World depicting trends in F. The trends take into account the number of stock assessments (thickness of line) and Biomass against the Biomass that provides for a maximum sustainable yield (colour green to red – where green is + and red -).
Source: Unpublished Chart (Ray Hilborn)
Look at my native New Zealand? Good progress… But I notice a slight colour change from pea green to light green. That represents a change in Biomass/BMSY from >2.5 to 1.5.
Although this is still >1 it isn’t by much it might indicate a need to tweak management decisions for some fisheries and implement a slight decrease in F!
Related articles
- Increase in fish stocks targeted by Scots fishermen (scotsman.com)
- Scientific evidence backs North Sea cod abundance (worldfishing.net)
- New Zealand Fisheries: Healthy stock status should mean healthier TACC’s right? (greenfishbluefish.wordpress.com)
- Sustainable Irish Sea herring fishery envisaged (belfasttelegraph.co.uk)
- New Zealand Fisheries: Most fish stocks in a healthy state! (greenfishbluefish.wordpress.com)
- North Sea fisheries making a recovery: Cooler seas, busier plankton? (tallbloke.wordpress.com)
- Catching those Tuna: The challenges of purse seine versus longline tuna fishing (greenfishbluefish.wordpress.com)
- Can Fish Eco-Labeling be Trusted? An MSC Label Can!! Right? (greenfishbluefish.wordpress.com)
- Panel approves ecosystem plan for West Coast fisheries (oregonlive.com)
- Is a stock overfished if it is depleted by [recruitment] overfishing? (greenfishbluefish.wordpress.com)
